Live traffic & Inspector
Every tunnel records the JSON-RPC traffic that flows through it. The dashboard
gives you two views over that traffic — a real-time Live tail and a
persisted Inspector history — plus a per-event drawer and a Replay
editor for re-firing a tools/call with edited arguments.
These views read recorded metadata and payloads. A tunnel in zero-knowledge mode routes bytes only and records nothing, so its Live and Inspector tabs stay empty by design.
Live tab
Section titled “Live tab”The Live tab streams events as they happen over Server-Sent Events. Each row is one JSON-RPC call, showing:
- the tool name (or the method, e.g.
initialize, for non-tool calls); - the latency in milliseconds;
- the status code as a colored badge (green for success, red for errors).
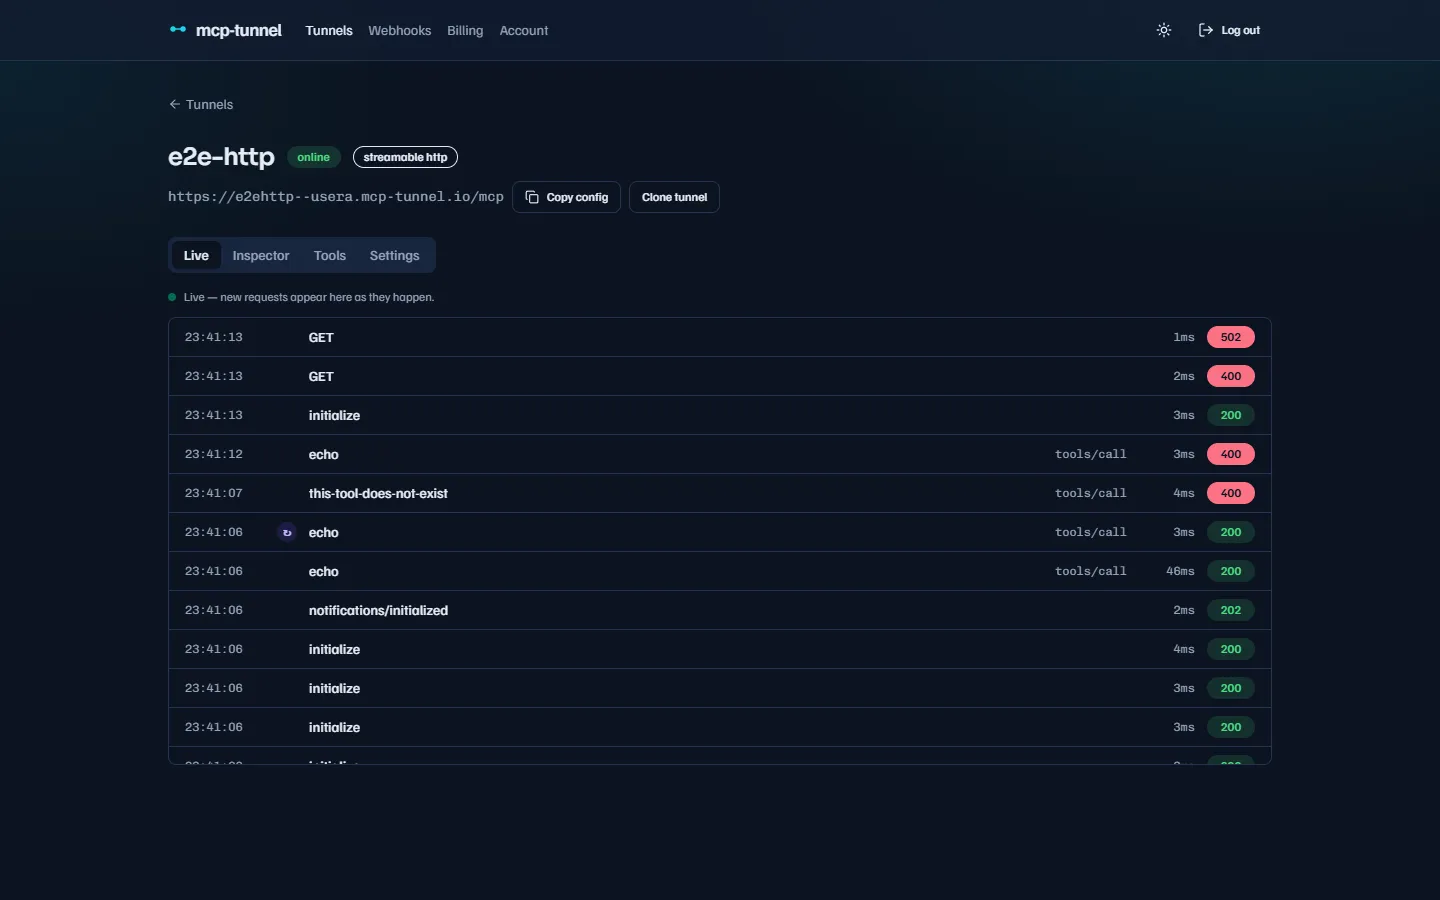 The Live tail — new requests appear at the top as they arrive.
The list is seeded with recent history so it is not empty when you open it, then
appends new events off the stream. A pulsing green dot reads
“Live — new requests appear here as they happen”; if the stream drops it turns
red (“Live stream disconnected — reopen the tab to retry”). Events are deduped
by id and the list is capped at the 200 newest rows. A row that came from the
Inspector’s Replay action is tagged with a ↻ marker so you can tell replays
apart from real traffic.
Click any row to open the event drawer.
Inspector tab
Section titled “Inspector tab”The Inspector is the persisted history, browsable after the fact. It loads recorded events newest-first (the list is paginated; the full payload of each event is fetched on demand when you open it). How far back the history reaches depends on your plan’s retention window — see Billing & plans.
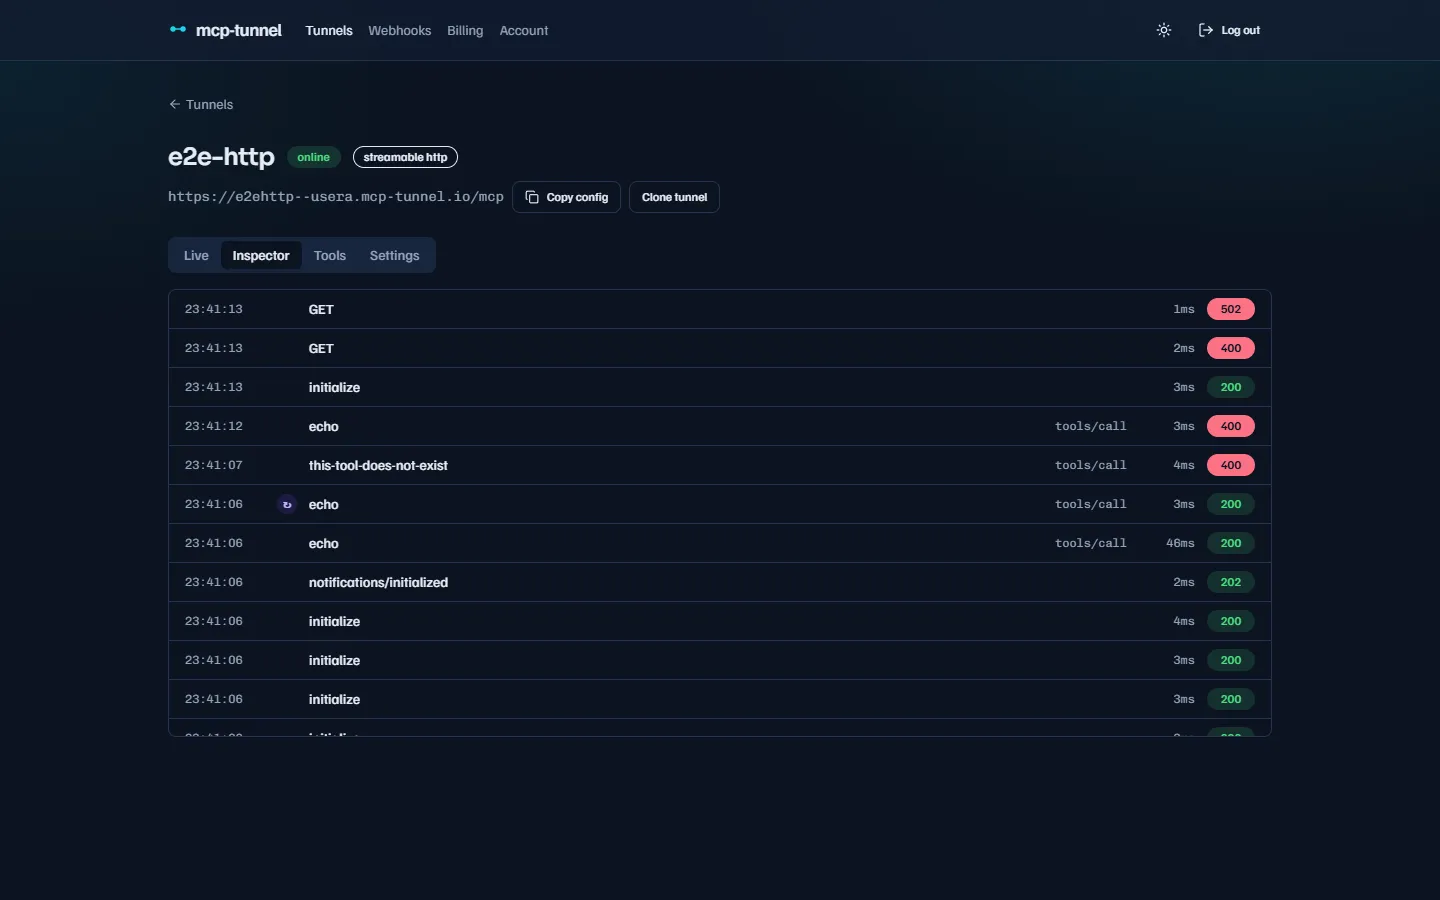 The Inspector history, with the upstream filter for aggregator tunnels.
For an aggregator tunnel that fans out to several
upstreams, an Upstream dropdown lets you filter the list to one upstream.
The filter reads the aggregator’s <upstream>__<tool> naming convention and
only offers upstreams present in the loaded history, so it never shows a value
with no rows behind it.
Event drawer
Section titled “Event drawer”Selecting an event in either tab opens a right-hand drawer. The Details tab shows the full picture for that one call:
| Field | Meaning |
|---|---|
| Method | The JSON-RPC method, e.g. tools/call. |
| Tool | The tool name for a tools/call, otherwise —. |
| Direction | inbound (a request entered the tunnel) or outbound. |
| Status | The HTTP status code badge (red when the call errored). |
| Latency | Round-trip time in milliseconds. |
| Message id | The JSON-RPC message id. |
| Session | The agent session the call belonged to. |
| Replay of | Present only on replay events — a clickable link to the original. |
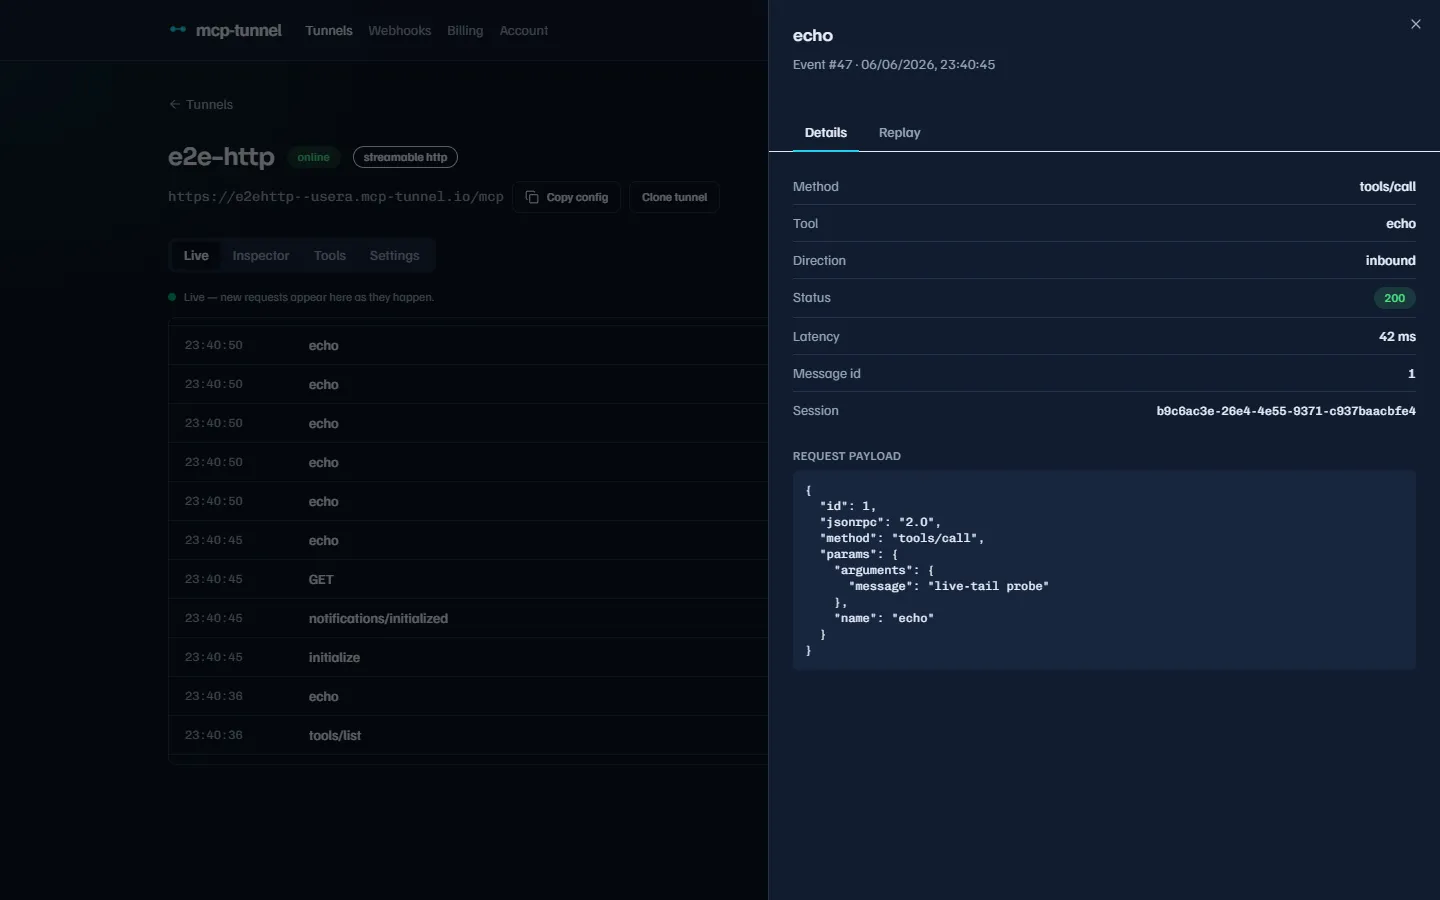 The Details pane — request arguments, and the recorded response when one exists.
Below the fields, the drawer renders the Request payload (the JSON-RPC
request, including params.arguments). When a response has been recorded for
the event — replays stamp the upstream’s answer back onto the row — a
Response (recorded) pane appears beneath it.
If the event is itself a replay, the Replay of #N row links back to the
original. Clicking it fetches the original (even if it has scrolled off the
current page) and pivots the drawer onto it. A not available message means the
original was purged by retention.
Replay with edited arguments
Section titled “Replay with edited arguments”For a tools/call event that has a recorded payload and is not itself a replay,
the drawer offers a Replay tab. This lets you re-fire the same tool against
the same tunnel with edited arguments — a fast “tweak one field and resend”
loop for debugging.
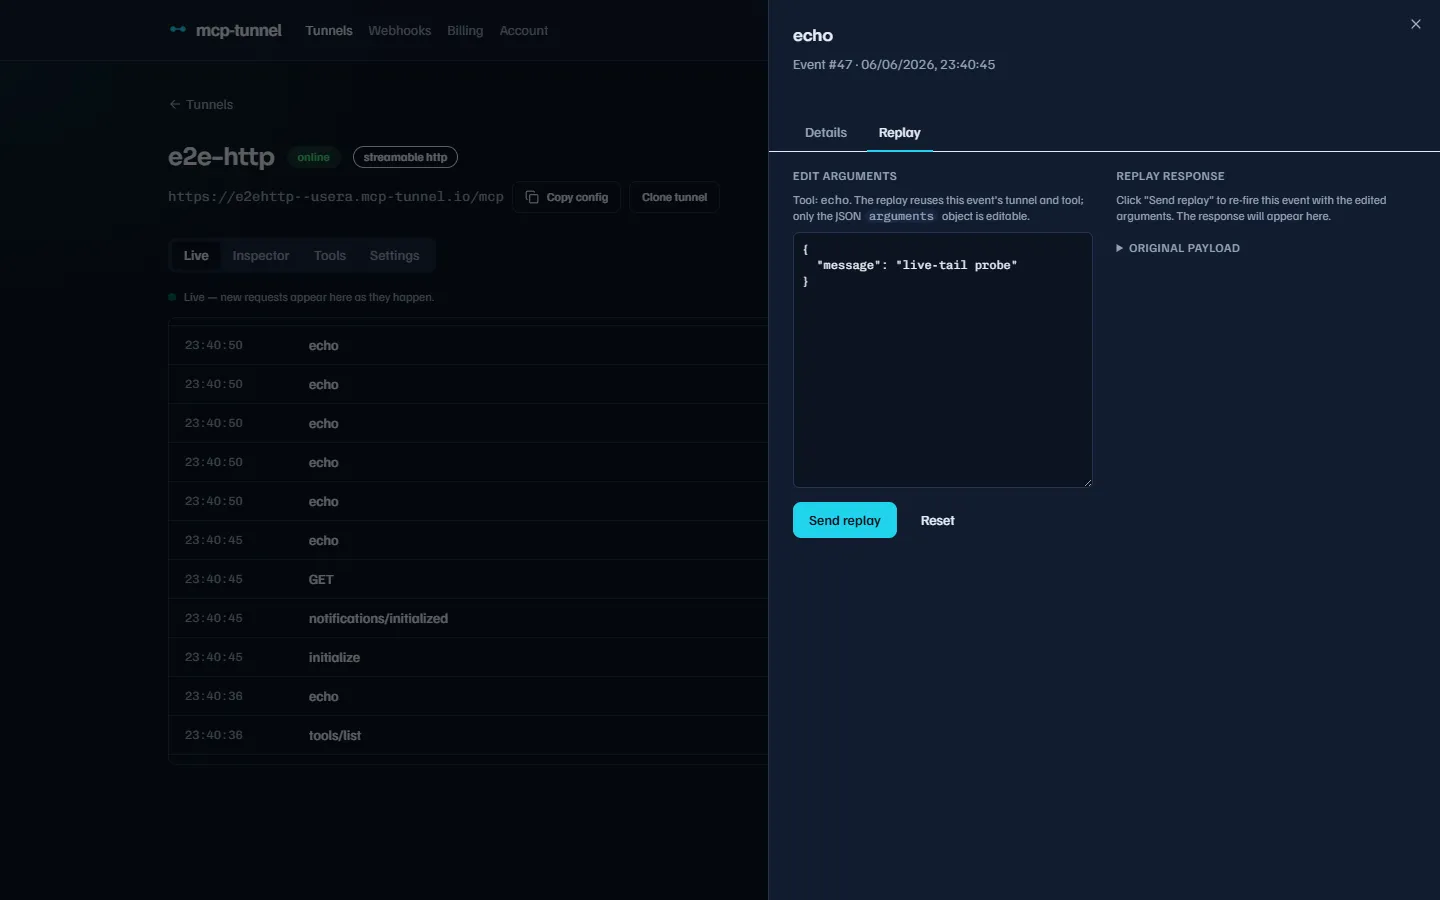 The Replay editor — edit the JSON arguments on the left, see the live response on the right.
Only the arguments JSON object is editable. The method stays tools/call and
the tool name is preserved from the original event, so a replay can never drift
into a request the tunnel cannot serve. The editor validates that your draft is
a JSON object before enabling Send replay; Reset restores the original
arguments.
When you send, the response appears on the right with its own status badge,
latency, and a → event #N link to the freshly recorded replay event. That new
event carries a replay_of pointer back to the original, so it shows up in the
Inspector with the ↻ marker and a clickable Replay of #N cross-link.
How replay routes
Section titled “How replay routes”The replay runs server-side through an owner-authorized loopback, taking the same forwarding path real traffic does — so the replay is handled identically to a live request and is traced end-to-end just like real traffic. Because you have already authenticated with your dashboard session and own the tunnel, the replay path bypasses the tunnel’s OAuth and IP-allowlist gates and its tool policy and rate limits. The owner-scoped edits are the authorization.
Behavior to know:
- Replays cannot be chained. Replaying a replay is rejected — replay the original instead.
- A replay opens a fresh MCP session for the call and tears it down afterward, so it is self-contained even months after the original.
- Replay has a 30-second timeout. A stored response preview larger than 64 KB is
replaced with a
_truncatedplaceholder (the dashboard still shows the full body returned in the replay’s own response). - If replay is not enabled, the Replay action returns
503and the dashboard shows “Replay disabled”.
API endpoints
Section titled “API endpoints”The dashboard views are backed by these owner-scoped endpoints. A tunnel you do
not own — or one that does not exist — returns 404, never 403.
| Method & path | Purpose |
|---|---|
GET /api/tunnels/:id/events | Recent event headers, newest first (paginated via ?before=<id>&limit=<n>, n clamped to 1–100). |
GET /api/tunnels/:id/events/:event_id | One event with its full payload. |
GET /api/tunnels/:id/events/stream | The Live tail, as Server-Sent Events. |
POST /api/tunnels/:id/events/:event_id/replay | Replay a tools/call with { "arguments": { … } }. |
GET /api/tunnels/:id/events/:event_id/replays | List every replay of an original event. |
Related
Section titled “Related”- Tool governance — per-tool stats, allow/deny policy, and rate limits.
- Privacy: redaction & zero-knowledge — what gets recorded and what is masked.
- Dashboard reference — the full tunnel-detail tab layout.